
The Anatomy of Brown’s Gold Bottom, Report 11 June, 2017
As most in the gold community know, the UK Chancellor of the Exchequer Gordon Brown announced on 7 May, 1999 that HM Treasury planned to sell gold. The dollar began to rise, from about 110mg gold to 120mg on 6 July, the day of the first sale. This translates into dollarish as: gold went down, from $282 to $258. It makes sense, as the UK was selling a lot of gold… or does it?
We won’t get into the theories of his motivation. However, we note that if he wanted to—pardon the dollarish—push down gold, he was not particular effective. He squandered half of Britain’s gold to get the price to drop 8.5%. That lasted but a few months. By the end of September, the price was not only back up to $282 but rising rapidly on its way past $320. Then it came down with volatility, rose, slowly fell to just under $260 about two years later. The price bottom just about coincides with the end of his selling.
This is history, and it’s been discussed and analyzed many times. What has not been seen until now is a look at the gold basis and cobasis during this time. Was gold becoming abundant due to selling? Or did something else happen?
Here is a graph showing the continuous gold basis and cobasis, overlaid with the price of the dollar.
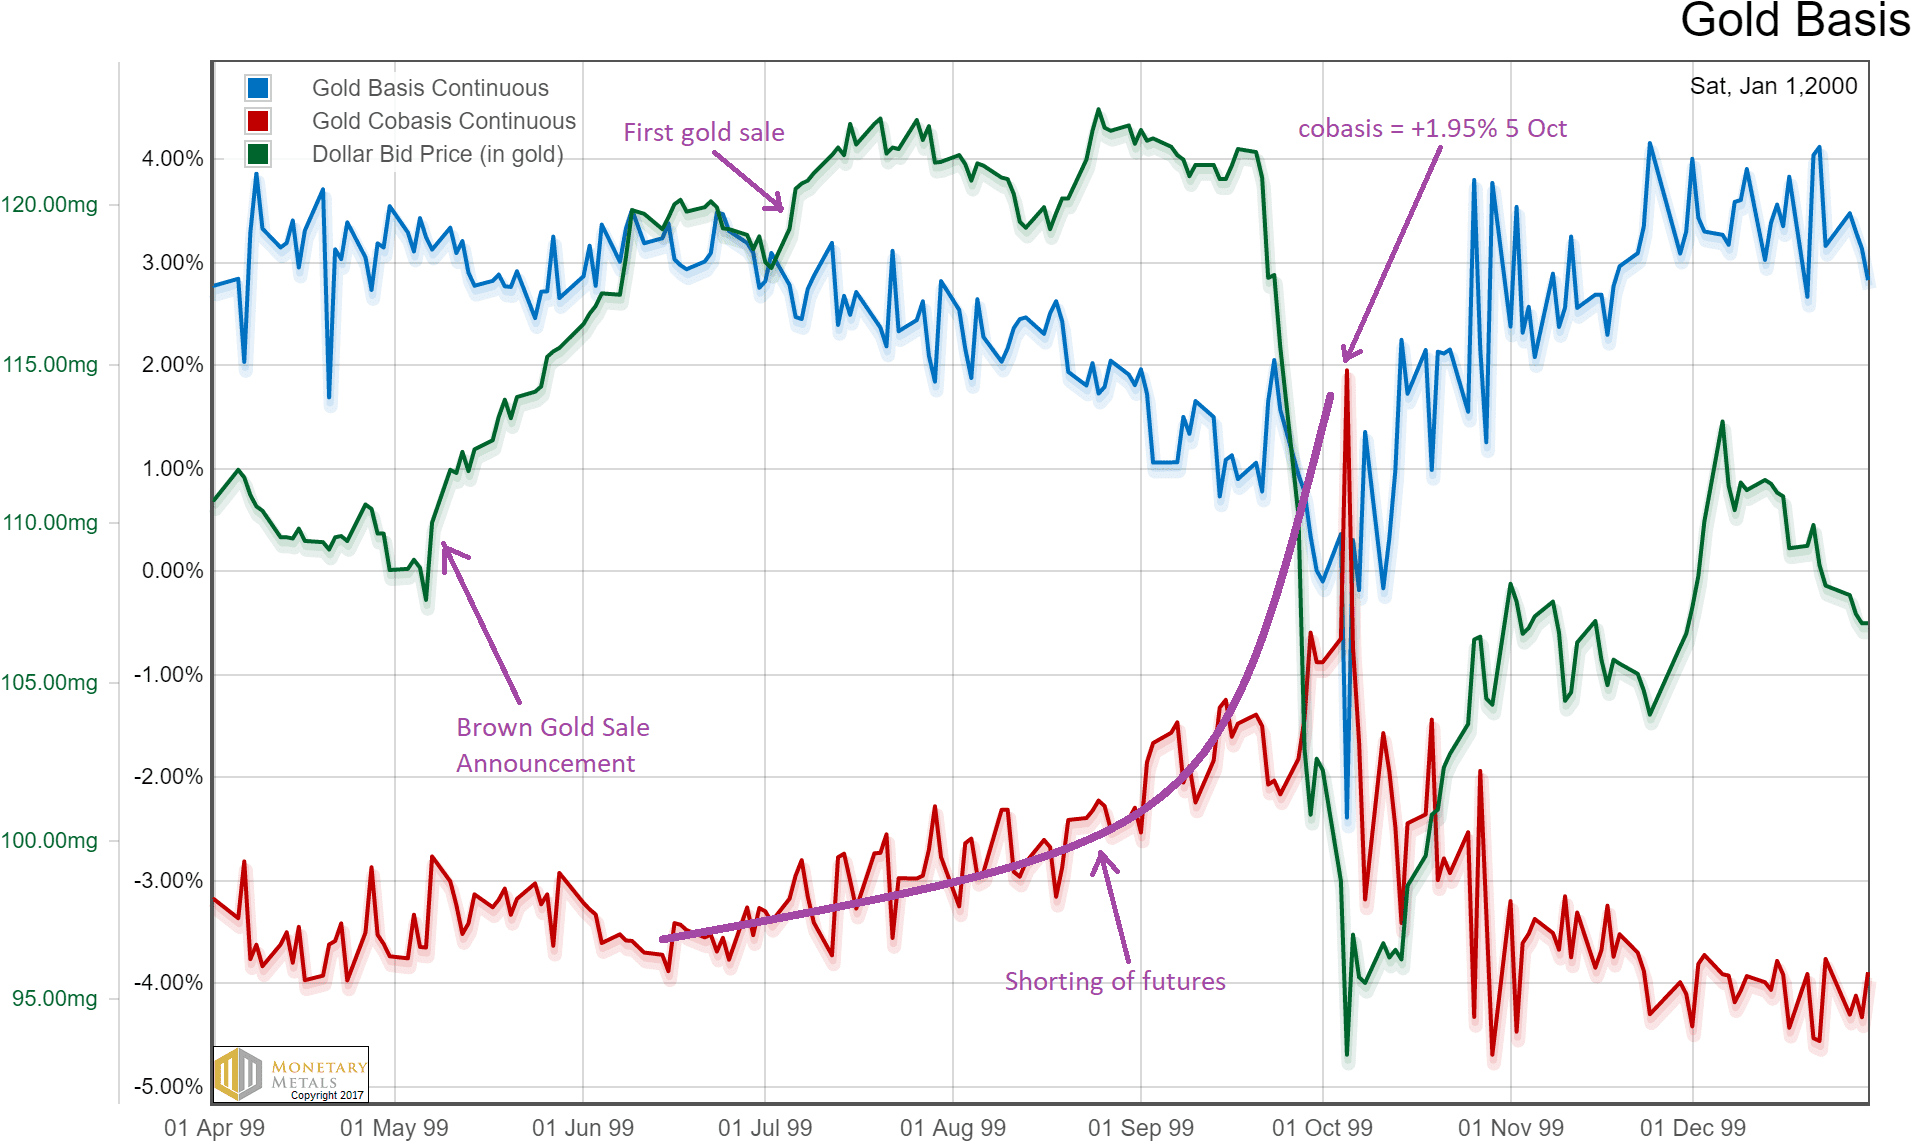
Several features are noteworthy:
- The basis begins to fall on the announcement, but not a lot yet. The cobasis may be arguably said to begin to rise. Both appear to change character.
- The dollar begins rising immediately (i.e. the price of gold falls), but nothing alarming happens in the basis yet. Almost the entire initial price move occurs, with little move in the basis.
We believe this confirms our view that there is a lot of gold out there. This was as clear a case of short selling as can be. Brown wasn’t even selling yet, and the market price was driven down 8.5%. Actually, the market price began falling before the announcement, which suggests that privileged information may have leaked. Yet the market makers handled this with aplomb. The basis moved, but not that much.
- Once he began the actual selling, the price did not move much further. Notably, the basis and cobasis begin much larger moves. Gold became significantly scarcer.
- Three months later, we see a wicked backwardation. That is no small number, like the many little temporary backwardations of today. That was a cobasis of +1.95%. And not a near-month contract cobasis, but the continuous cobasis. This is big, albeit only one day.
Wait… Brown is selling large quantities of gold and yet gold is become less abundant and scarcer, peaking at significant scarcity indeed? Selling physical metal should—all else being equal—cause it to become more abundant. But it didn’t.
It’s appropriate to quote Sir Arthur Conan Doyle here (doubly so, as Keith is in London at the moment). “When you have eliminated the impossible, whatever remains, however improbable, must be the truth.”
Those fool speculators thought they could short gold with impunity. After all, the price dropped. A major country was selling in quantity. We assume the charts painted a bearish picture. Even some gold bugs may have thought that with major governments against them, the price could be driven down even further. This was the end of a long period of a falling gold price. Sentiment must have been in the pits.
- Gold could become scarcer for a while, and to a point.
- But when the shorts push it past the breaking point, the price of gold snaps violently to the upside.
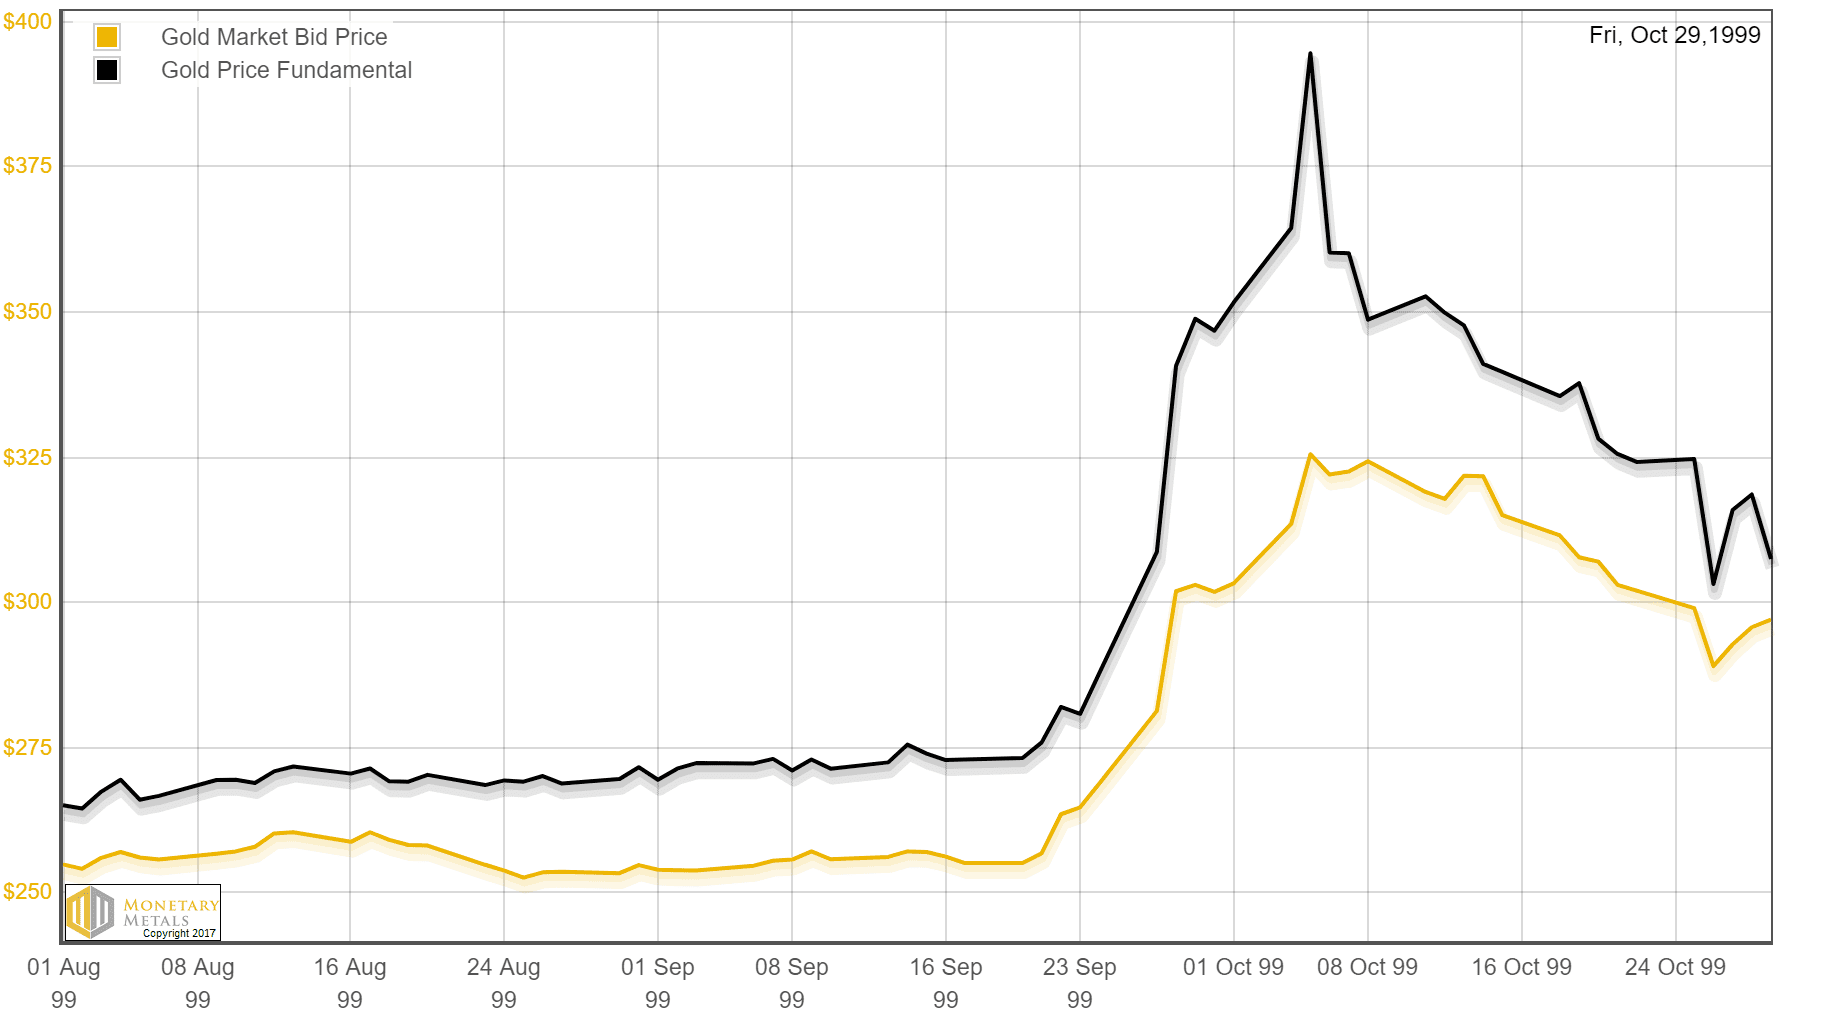
If you were watching the basis, you would have seen this move coming. Here is a graph of our fundamental price, zoomed in to show just a small window around the price explosion.
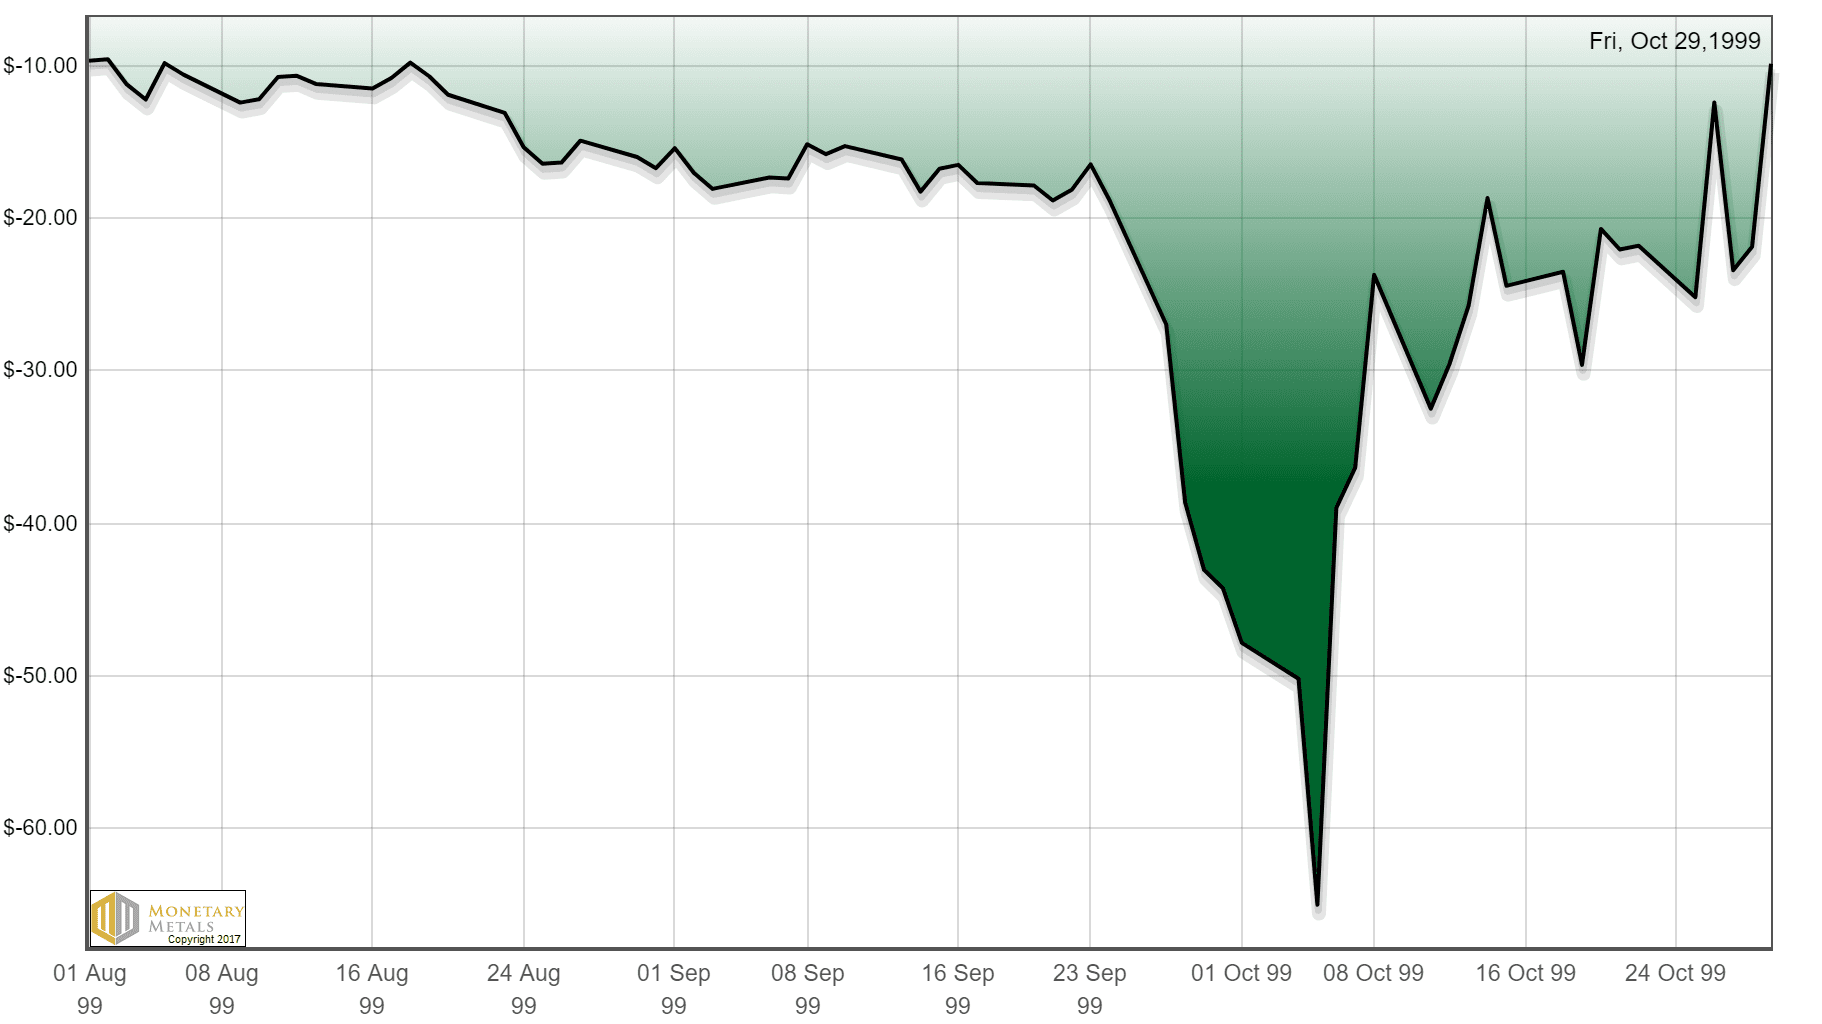
The difference between the fundamental and market prices gives us the premium or discount. Here is a graph of that for the same time period.
You might have traded before the fundamental moved decisively based on the basis graph. In any case, by 27 Sep the fundamental was up sharply and the market price was still only $281.
You might have closed the trade when the price hit $325 by 5 Oct. A week later, and you had a 16% gain. The fundamental by itself would still have gotten you out of the trade. By 14 Oct, it had overshot and come back down and was clearly falling. The exit price was only $4 lower that day, $321.
Daily updated charts of the basis, both near contract and continuous, fundamental, and premium/discount are available on our website.
There is one other thing worth mentioning. Linear thinking may be tempting and convenient. However, we see here that Brown set something in motion. A linear view would ask how much price drop to expect for a given quantity of gold. Like draining a tank of liquid, how much will the level drop for a gallon pumped out?
That is not what happened. This is more like a resonant system. Brown jerked on a spring. He set it in motion, reverberating for quite some time. And the price ended up moving higher, both in the short term (4 ½ months later) and long term (a bull market that went for a decade, and took the price up more than 6 ½ times).
Obviously, many buyers increased their purchases of gold perhaps in response to the drop in price. New buyers came into the market. Perversely, in a world where central banks are selling their gold—literally debasing their currencies—there is more reason to own gold.
A linear model like supply and demand curves cannot explain what happened (or predict what will happen). Virtually all of the gold mined over thousands of years is potential supply, at the right price and under the right conditions. Everyone is potential demand, at the right price and under the right conditions. Brown had a modest effect on price, but he perturbed the market and that changed the conditions.
The other sellers of gold (metal, not futures contracts) decided they might rather not sell and/or buyers stepped up their purchases. Ironically, it could even have been the British, who had been happy to own pounds knowing that each pound represented a certain amount of gold backing. Brown’s move convinced them to buy the gold, and he ended up simply shifting gold to the people. This is just conjecture, but it would fit.
…
This week, the prices of the metals fell. However, with all the previous discussion, we are sure you want to see the fundamentals of supply and demand.
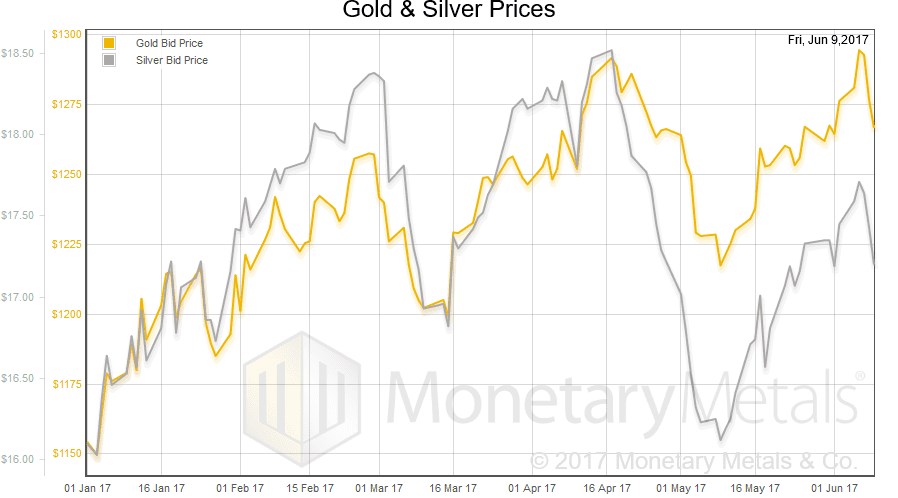
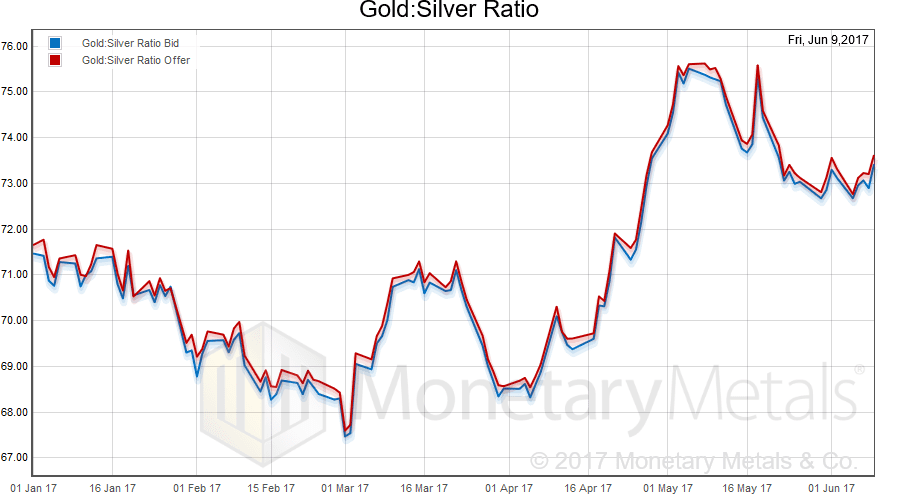
Next, this is a graph of the gold price measured in silver, otherwise known as the gold to silver ratio. It moved up a bit.
In this graph, we show both bid and offer prices. If you were to sell gold on the bid and buy silver at the ask, that is the lower bid price. Conversely, if you sold silver on the bid and bought gold at the offer, that is the higher offer price.
For each metal, we will look at a graph of the basis and cobasis overlaid with the price of the dollar in terms of the respective metal. It will make it easier to provide brief commentary. The dollar will be represented in green, the basis in blue and cobasis in red.
Here is the gold graph.
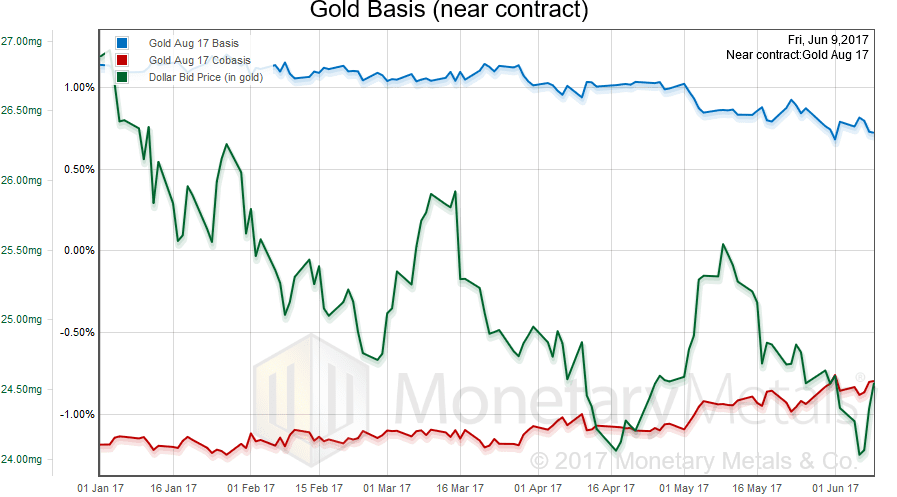
We had a rising price of the dollar (the mirror image of the dropping price of gold), and a slightly falling abundance (the basis) and slightly rising scarcity (the cobasis). Our gold fundamental price shows a decrease of $10 (to $1,324).
Now let’s look at silver.

In silver terms, the dollar rose more (i.e. the price of silver fell more). The metal became less abundant and scarcer. Our silver fundamental price shows a decrease of 11 cents (to $17.52).
Keith will be in London the week of June 19, and in New York the week of June 26. If you’re interested in attending a Monetary Metals seminar on GOFO and transparency in the gold market in either city, or to meet with Keith to discuss gold investment, please click here.
© 2017 Monetary Metals


Here is a link to an article on backwardation in palladium. As i understand it, basis analysis would be applicable between platinum and palladium, et. al. See post
script at end of article .
http://themacrotourist.com/macro/palladium-short-squeeze
I asked a contact of mine about this palladium backwardation, his comment was “It feels like there is a lack of ingot in the market. The problem is that consumers don’t want ingot so nobody really produces much. But the banks trade ingot so that is where liquidity is needed. The ingot premium has widened but last I saw it was still not overly attractive to refiners so it might take some time for this situation to sort itself out if we understand what is happening.”
I would also note that there are a number of palladium ETFs, holding around 1.5 million ounces, and that Nymex warehouse stocks went into a rapid decline beginning 2014 from 600,000oz to 42,000oz today and it is possible some of that warehouse stock is held by an ETF and thus not available to profit from this backwardation (ie decarry, selling physical spot and buying futures cheaper), although that wouldn’t stop a trader from buying an ETF that allows physcial redemption and selling futures against it.
Bron, Thanks very much for your input. Your insider insights are always appreciated in these murky matters. Reasoned analysis is scarce as hen’s teeth in metals markets. Both you and Keith are to be commended.