
Think Differently About Purchasing Power

The dollar is always losing value. To measure the decline, people turn to the Consumer Price Index (CPI), or various alternative measures such as Shadow Stats or Billion Prices Project. They measure a basket of goods, and we can see how it changes every year.
However, companies are constantly cutting costs. If we see nominal—i.e. dollar—prices rising, it’s despite this relentless increase in efficiency. This graphic illustrates the disparity (I credit Tom Selgas for a brilliant visualization, which I recreated from memory).
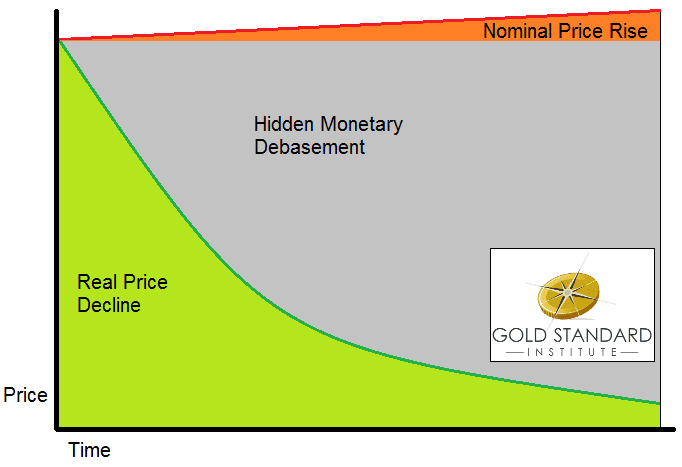
CPI measures only the orange zone, the tip of the iceberg. Most people don’t see the gray zone, and that’s a result of the greatest sleight of hand ever.
We need an accurate way to measure monetary debasement. For example, in retirement planning it’s tempting to divide your net worth by the cost of consumer goods. This seems to show your purchasing power. For example, if you have $200,000 and the cost of groceries for a year is $20,000 then you can eat for ten years.
However, this approach is flawed. To see why, let’s briefly consider primitive times when there was no lending or banking. People had to set aside some of their income, to buy a durable good like salt or silver—hoarding. When they could no longer work, they sold a little bit every week to buy food—dishoarding. People accumulated wealth while working, and dissipated it in retirement.
Life got a lot better with the advent of lending, because interest enables people to live on the income generated by their savings. People no longer consumed their principal, worrying about outliving their savings.
Don’t think of capital assets as something to sell in order to eat. An old expression says, if you give a man a fish then he eats for a day, but if you teach a man to fish then he eats for a lifetime. Think of a productive asset like a fishery. It should produce for a lifetime. It should not be consumed as a mere fish.
Capital assets should be valued in terms of how many groceries they can buy, not by liquidation, but by production. Unfortunately, monetary policy is making this increasingly difficult. Interest rates have been falling for over three decades, and now there’s scant yield to be had anywhere. We are regressing to the dark ages of paying for retirement by dishoarding.
CPI understates monetary debasement, because companies are constantly becoming more efficient. Dividing wealth by CPI compounds the error, because asset prices are rising.
We need a different way of looking at monetary debasement. I propose Yield Purchasing Power (YPP). YPP is the yield on assets divided by the Consumer Price Index (or other index). The idea is to look at the productivity of assets to see what you can really afford.
Let me explain YPP with a simple example. If hamburgers sell for $5 and interest is 10%, then $50 of capital lets you eat one burger per year. Suppose the price of the burger doesn’t change, but the interest rate falls to 0.1%. You now need $5,000 in capital to earn that burger. Unfortunately, if you still only have $50, then you only get one burger every 100 years.
CPI doesn’t show this collapse in purchasing power, but YPP does.
Let’s take a look at YPP since 1962. The graph is inverted, to make the trend easier to see.
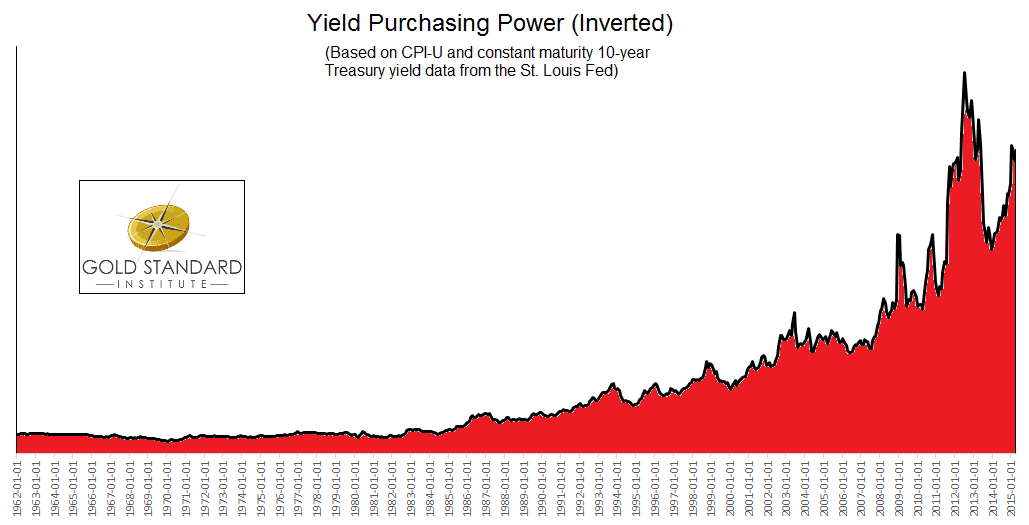
It’s interesting that the drop in purchasing power (rising in this inverted graph) begins around 1984, when the conventional view said inflation was tamed. CPI may have slowed down, but interest was falling too.
YPP shows us a staggering monetary devaluation—a classic parabola. The problem isn’t skyrocketing prices, but collapsing yields.
You need more and more assets to afford the same lifestyle. If your assets don’t keep up, then you have to liquidate your capital.
I have moved my weekly column from Forbes to the Swiss National Bank and Swiss Franc blog. I don’t plan on posting most of those articles here (except those that may be relevant, as I think this one is). The column is somewhat outside the focus of Monetary Metals. So I encourage those interested to subscribe at that site to receive notification when new articles are up.


Keith,
Isn’t this analogous with saying that real interest rates have largely been negative since the mid-80’s?
Mark
Keith: Very interesting metric. Fits in with a recent meme “Many of us are rentiers now — whether we want to be or not” kicked off by Thomas Piketty…
That is an excellent observation. However, I prefer the chart not inverted to show the loss in purchasing power. In the link below I added what could be labelled Gold Purchasing Power, i.e., gold/10-year yields. Interesting.
https://stockcharts.com/h-sc/ui?s=%24TNX%3A%24%24CCPI&p=M&b=1&g=0&id=p71453674262&a=406127784
Thanks for the comments.
miamonaco: The discussion of “real” vs. “nominal” interest rates is based on the idea that the dollar is 1/P (P is the price level). If prices double, then that means the dollar has lost half its value. This is wrong on several levels and for many reasons. One, per the first graph in this article, companies are constantly cutting real costs. Two, there are many nonmonetary forces that push prices up including: taxes, California water mismanagement, environment restrictions, regulation, permitting, labor law, litigation, etc. Anyways, in this view, the interest rate we see is not real. To calculate the real one, subtract the CPI.
This isn’t what I am saying, above. I am saying don’t think of selling your assets to buy food. That is to consume your capital. I am saying thinking of the return you get on your portfolio, and buying food with that.
Phil: I looked at the graph but I don’t understand. What did you do with gold? Thanks.
This is an insightful article, Keith, and it’s the first time I’ve seen both currency debasement and increases in efficiency both taken into account in an assessment of the damage. Here’s what I tell people: You know (or may not know) that the dollar is only worth 4% of what it was worth in 1913. What happened to the other 96%? That value was stolen through currency debasement. But what about all the incredible increases in efficiency, economies of scale, etc. that have come about since then? Shouldn’t prices be MUCH LOWER than they were in 1913, all other things being equal? Shouldn’t the dollar buy much more now, rather than less? THAT VALUE WAS STOLEN TOO! It’s akin to Bastiat’s “Things not seen” argument.
Sorry. The link mangled the chart. All I did was to divide gold by the CPI and got interesting results.
davidnrobyn: The dollar was worth 1505mg gold in 1913. Today it is worth about 26.25. This is a loss of 98.3%. I agree it’s theft. And that theft of value is the *least* of the harms done to us by the fiat dollar regime.
Keith, I think this is a very nice and appropriate chart. But why not have another line drawn, giving the development of earnings? That is as an example average hourly earnings adapted to inflation?