“That [half a dollar of buying] frenzy was not stackers lining up to buy phyz. It was speculators buying paper.
Why does that matter? Speculators, who typically use leverage, can’t hold the market price against the tide of the hoarders. They can push for a while, but they have to close their positions sooner or later, either to take profits (as they reckon them, in dollars) or to stop losses.”
This is what we wrote last week. It turned out to be prescient. This week, the price of silver gave up all of that and more, ending at $13.91. That’s down 63 cents.
We don’t believe that labor reports drive the prices of the monetary metals. Labor reports may be a driver of the Fed’s interest rate decisions. Maybe (we think the Fed cares most about three things: its own solvency, bank solvency, and the government’s endless need to borrow more).
In any case, speculators certainly do not drive the price of metal. Just not durably. Sometimes they can distort it for longer (as we recall happened in the summer of 2013) and sometimes they are a flash in the pan. This is one reason why we watch the basis. It is a measure of speculators vs. hoarders. Only the latter, only monetary reservation demand, can permanently drive the prices of the metals up to whatever level.
It’s the flip side of the collapse of the dollar. The value of the dollar is not 1/P (price level) nor 1 / N (quantity of dollars). It’s whatever people will pay for it. That is ounces of gold. Or more like milligrams at this point.
Gold is not going anywhere (though silver can go up and down, in gold terms). It’s the dollar that mostly goes down, though not this week in silver terms! The dollar is now up to 2¼ grams of silver.
Read on for the only true look at the fundamentals of gold and silver. But first, here’s the graph of the metals’ prices.
The Prices of Gold and Silver

We are interested in the changing equilibrium created when some market participants are accumulating hoards and others are dishoarding. Of course, what makes it exciting is that speculators can (temporarily) exaggerate or fight against the trend. The speculators are often acting on rumors, technical analysis, or partial data about flows into or out of one corner of the market. That kind of information can’t tell them whether the globe, on net, is hoarding or dishoarding.
One could point out that gold does not, on net, go into or out of anything. Yes, that is true. But it can come out of hoards and into carry trades. That is what we study. The gold basis tells us about this dynamic.
Conventional techniques for analyzing supply and demand are inapplicable to gold and silver, because the monetary metals have such high inventories. In normal commodities, inventories divided by annual production (stocks to flows) can be measured in months. The world just does not keep much inventory in wheat or oil.
With gold and silver, stocks to flows is measured in decades. Every ounce of those massive stockpiles is potential supply. Everyone on the planet is potential demand. At the right price, and under the right conditions. Looking at incremental changes in mine output or electronic manufacturing is not helpful to predict the future prices of the metals. For an introduction and guide to our concepts and theory, click here.
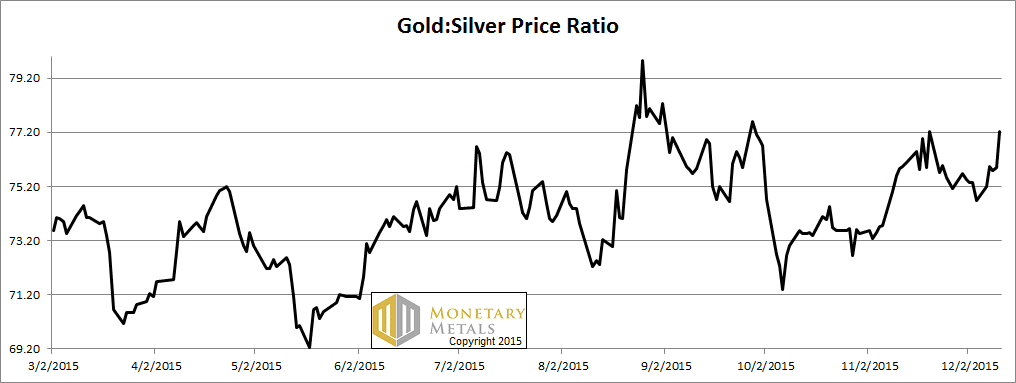
Next, this is a graph of the gold price measured in silver, otherwise known as the gold to silver ratio. The ratio jumped sharply this week. Silver got cheaper in gold terms, down to under 1/77 ounce of gold per ounce of silver. Where to from here? Below, we will provide our assessment.
The Ratio of the Gold Price to the Silver Price
For each metal, we will look at a graph of the basis and cobasis overlaid with the price of the dollar in terms of the respective metal. It will make it easier to provide brief commentary. The dollar will be represented in green, the basis in blue and cobasis in red.
Here is the gold graph.
The Gold Basis and Cobasis and the Dollar Price

The cobasis (i.e. scarcity of gold) and price of the dollar (which is inverse of the price of gold, measured in dollars) continue to track. Kinda. Note that this week, the price of the dollar about 0.3mg gold, but the cobasis is down. Gold became less scarce while its price fell.
Not that much. Only a little.
The fundamental price is holding steady, just under $100 and therefore about $120 over the market price.
Now let’s look at silver.
The Silver Basis and Cobasis and the Dollar Price

In silver, the picture is the same. Only uglier.
The price of the dollar in silver terms made a new high for the move. The cobasis isn’t really breaking out. The silver fundamental price is down almost 40 cents from last week (like everything else about silver, the fundamental price is more volatile than that of gold). It’s still above the market, but not by a lot—around 40 cents.
If you divide the fundamental gold price by the fundamental silver price, you get the fundamental gold to silver ratio.
Dare we risk printing the number, without generating too much hate mail?
OK. OK… 83.
Like any fundamental calculation of value, there is no guarantee that the market price will hit the fundamental value. And of course fundamental value is changing all the time too. That said, the fundamental ratio is 7.5% over the market price. That has to be a strong pull.
© 2015 Monetary Metals


Are you serious…. 83? Lol… surely you jest!
No, no… I jest myself… I even supported this notion (i.e., speculation!) of yours that the GSR could hit 83 months ago. However, given that so much time has passed and the PM bottom appears nigh, I am inclined to speak against that happening unless silver can close below $13.40.
Because if this is roughly the bottom in metals, it should also approximate the peak in the GSR. To quote one of the more radical Austrian economists, silver typically goes “foom” more quickly than gold. Thus the GSR should decline.
Then again, if the PM bottom remains elusive in 2016 forget everything I just said. The GSR could be at 83 or 103… I have no idea. I just happen to believe silver is looking pretty good right now…. but my trading opinions necessitate frequent adjustments, naturally.
I have my own theory about the basis. Given that the nominal price seems forever stuck beneath the ‘fundamentally calculated price’ (henceforth “FCP”?!) during this intensely bearish phase, it’s seems entirely plausible that the nominal price might frequently exceed the FCP during more bullish phases. We’ll see, won’t we.
In a sense, then, the FCP could simply be a lagging indicator, not a leading one. The recent contraction in the basis, for example, could be an indication of waning speculative demand, nothing more nothing less. Along those lines, the GLD — the most common play thing for those into paper gold — bears watching as an indicator too. The total assets owned by the GLD trust, for example, comes in at a pathetic 630 tonnes, a persistent and dramatic drop from earlier 2015 levels. If history is any guide, a liquidation of that magnitude lays the groundwork for an imminent rally.
But, alas, history only rhymes… it does not repeat exactly. In the past such a decline in GLD assets would have spurred a rally. This time I don’t know. If 1045 holds, keep your fingers crossed. (How’s that for an investment strategy?)
Keith… you’re a good guy (which is why we show up and post a few thoughts here) and many of us are genuinely intrigued with your methodology. That said, so far this “pull” you discuss (such as with the GSR) has been happening only in reverse, as gold has fallen hundreds of dollars. With this kind of performance, then, I hope you can understand my brewing skepticism.
Question: Is this ‘basis calculation’ completely your own creation… or does anybody else in the economics world subscribe to this general way of looking at things? At first I thought you might be onto to something… something big even… but so far the “pudding” has provided little proof.
Merry Christmas Everyone… thanks for sharing your thoughts.
Much of what I write makes sense even to those who use the dollar as the unit of measure. But some of it makes absolutely no sense whatsoever if you think the dollar is the lighthouse, and gold is the rowboat tossing about on stormy seas.
I am humbled by the fact that even longtime readers still think in terms of gold going up or down. I will try harder to make it clear why that is not the case.
I studied under Antal Fekete. He wrote of the basis for many years, though I have taken it farther and of course he did not build a price model.
Btw, while the fundamental gold price has been *above* the market price, the opposite was true in silver until recently. I have been calling for a rising GSR publicly since about 50 (and longer for a private email list before going live with this site). At every downward zig and zag of the ratio (i.e. when the price of silver measured in dollars blipped up) the usual suspects chorused that silver was taking off again.
Nevertheless, the ratio is basically at its high for the move.
We shall see…
Hey Keith! Thanks for checking in.
Not sure why, I tend to see silver as more of an industrial metal as it’s largely a by-product of copper, etc…, then again I do own an increasing chunk of it at today’s prices but have my doubts whether it will ever see $50 again, except during the final hyper-inflationary blowoff. Then who knows what anything priced in dollars will be worth. At that point the focus isn’t on what the dollar is worth… the focus suddenly becomes: Is the dollar worth anything at all?
Of course the dollar is worth something… (it buys things, doesn’t it?) but what most don’t realize is that the dollar is on its inexorable path to intrinsic value. Some actually know what the problem is.. but they assume it’s so far in the future they don’t need an escape plan yet. They’re wrong in my opinion. Some have even posited that the dollar’s demise could be decades away…. but that’s a LONG time for a fiat currency when the historical average (for a fiat currency) is 35 years, give or take.
Since Nixon closed the gold window in 1971… that’s already over 40 yrs ago… so it could be time for things to get ‘dicey’ if you know what i mean.
In the end I’m less bullish on silver because of the developing depression, which compromises demand, as I don’t feel investor demand will compensate.
But why are you negative on silver? Or is it that you’re relatively more bullish on gold?
One nice thing in favor of silver is that, unlike gold, it’s used up and gone forever.
For the bulls, the high silver prices (the two peaks to $50) have only served to encourage massive new production…. and in a world that only knows and respects fiat money, it’s important to acknowledge that demand just isn’t there is any meaningful way.
http://money.visualcapitalist.com/all-of-the-worlds-money-and-markets-in-one-visualization/
The Argentine peso collapsed nearly 30% today, it is now at 2.22 milligrams of gold. Meanwhile the cobasis was the same across all world currencies. If the cobasis did not fall in response to the lower Argentine peso, wouldn’t the “fundamental price” of gold in pesos have skyrocketed today?
Would your model have indicated this price movement in advance if the Argentine peso had been substitued on your chart in place of the dollar? Why or why not?
I get the point about the incorrect method of looking through the “dollar lighthouse”.
Howerver, doesn’t this report make a similar mistake in only looking at gold traders with USD demoninated accounts on the CME exchange?
A thoughtful perspective, Pizza… and great questions, Good luck.
And especially good luck getting a response to a deeper question like yours. But who knows… it’s Christmas. Maybe Santa will show up after all.