
Monetary Metals Supply and Demand Report: 24 Aug, 2014
The gold and silver prices dropped $23 and $0.13, respectively. A 100oz gold future is now worth $2300 less than it was at the close a week ago on Friday. This is a loss of 1.8%. That’s not that bad, but the difficulty comes from the fact that one can buy them using leverage. Assuming you used 4:1 leverage (you are allowed a lot more than that), then you just lost over 7% of your capital. In one week!
The Monetary Metals Supply and Demand Report saves readers from that kind of loss. To see the pictures of the fundamentals, read on…
First, here is the graph of the metals’ prices.
The Prices of Gold and Silver
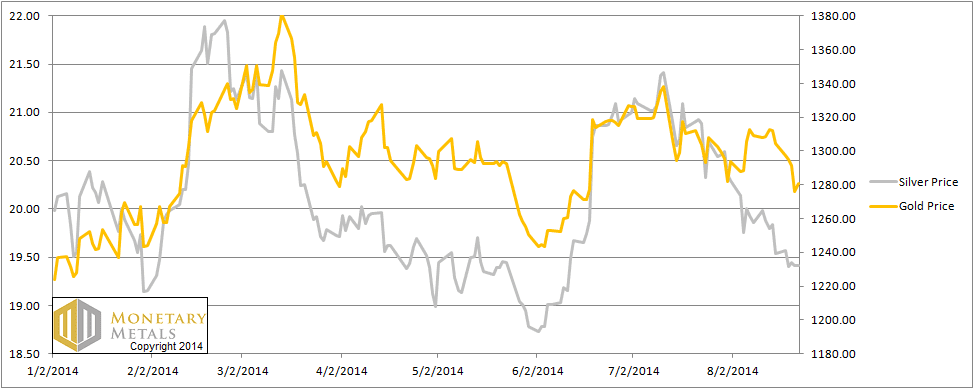
We are interested in the changing equilibrium created when some market participants are accumulating hoards and others are dishoarding. Of course, what makes it exciting is that speculators can (temporarily) exaggerate or fight against the trend. The speculators are often acting on rumors, technical analysis, or partial data about flows into or out of one corner of the market. That kind of information can’t tell them whether the globe, on net, hoarding or dishoarding.
One could point out that gold does not, on net, go into or out of anything. Yes, that is true. But it can come out of hoards and into carry trades. That is what we study. The gold basis tells us about this dynamic.
Conventional techniques for analyzing supply and demand are inapplicable to gold and silver, because the monetary metals have such high inventories. In normal commodities, inventories divided by annual production can be measured in months. The world just does not keep much inventory in wheat or oil.
With gold and silver, stocks to flows is measured in decades. Every ounce of those massive stockpiles is potential supply. Everyone on the planet is potential demand. At the right price. Looking at incremental changes in mine output or electronic manufacturing is not helpful to predict the future prices of the metals. For an introduction and guide to our concepts and theory, click here.
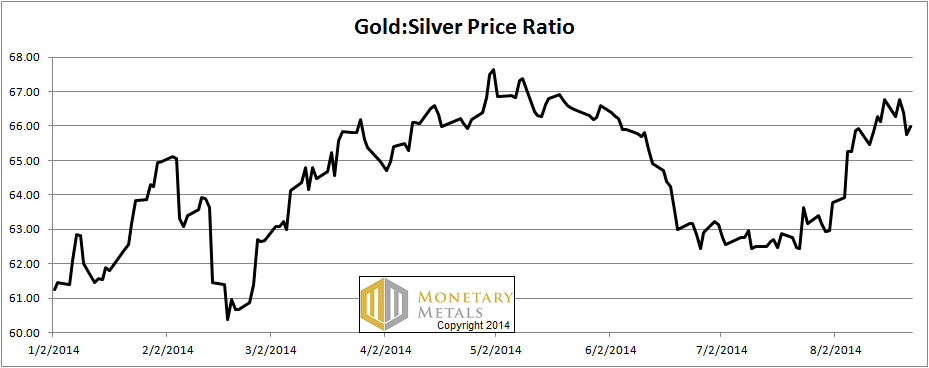
Next, this is a graph of the gold price measured in silver, otherwise known as the gold to silver ratio.
The Ratio of the Gold Price to the Silver Price
For each metal, we will look at a graph of the basis and cobasis overlaid with the price of the dollar in terms of the respective metal. It will make it easier to provide terse commentary. The dollar will be represented in green, the basis in blue and cobasis in red.
Here is the gold graph.
The Gold Basis and Cobasis and the Dollar Price
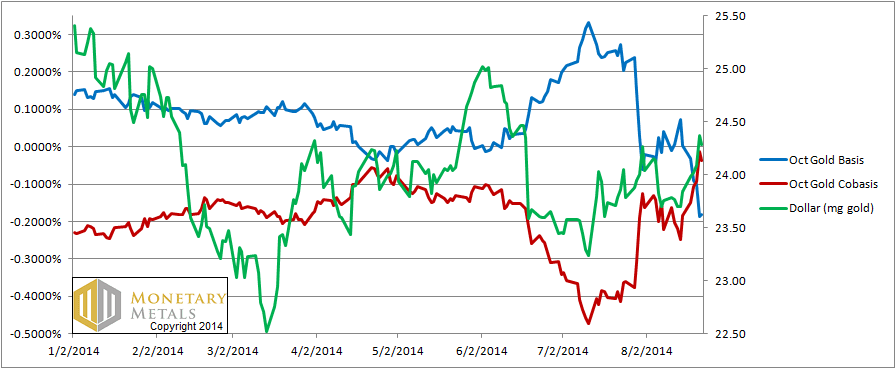
The cobasis (i.e. scarcity) and the dollar price (i.e. inverse of the gold price measured in dollars) continued their tight correlation for another week. Prices moves continue to be driven by speculators repositioning themselves. As speculators sell, the scarcity of gold goes up and dollar price goes up with it.
Now let’s look at silver.
The Silver Basis and Cobasis and the Dollar Price
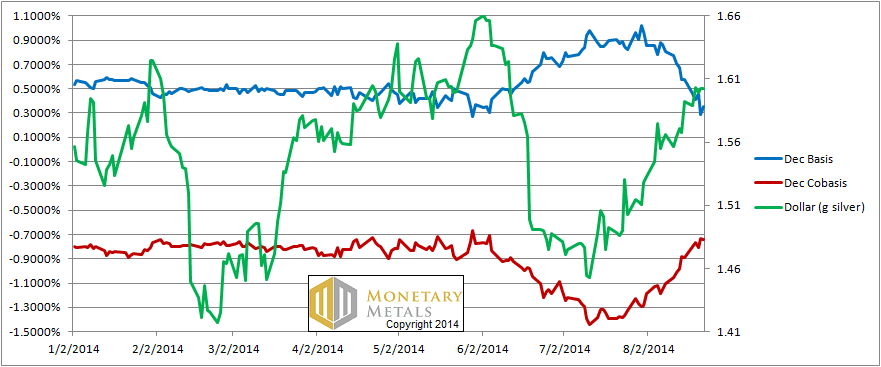
Though we are not showing the September contract any more, we do note that it has entered backwardation. This is the first instance of temporary backwardation in many a moon. It is called temporary backwardation because it affects only the contract that is rapidly moving towards expiry. Silver speculators are not buying September, this close to First Notice Day. Thus, its price can sag a few cents relative to spot and to other contracts. This is pathological, of course, but in the post-2008 new reality, such backwardation has been intermittent.
As with gold, the dollar is rising when quoted in silver too (i.e. silver price is falling) and the cobasis is rising. Moves in both price and cobasis are closely in synch, showing that speculators are driving both.
Finally, let’s take a look at a graph of the ratio of the open interest in gold and silver. This is the number of gold futures contracts divided by the number of silver futures that are open as of Friday. It presents an interesting counterpoint to the graph of the ratio of the metals’ prices above.
The Ratio of the Gold to Silver Open Interest
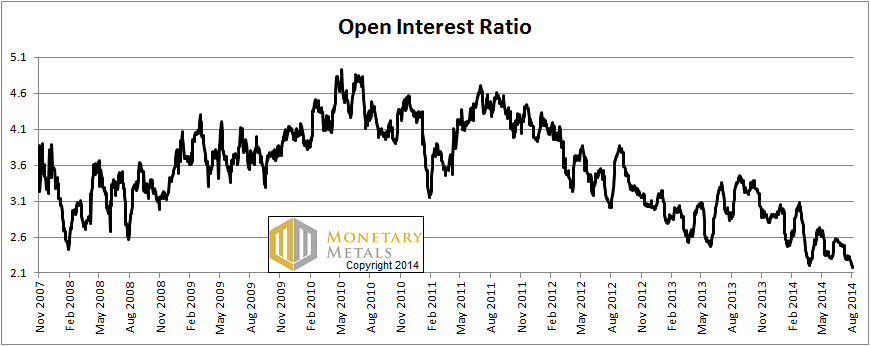
The open interest does not rise simply due to buying; it’s not that simple. However, the open interest is a reasonable proxy for speculation.
This chart is showing the same picture as we see in the bases for the metals. Gold speculation is moribund and silver speculation is booming. Not shown is the open interest itself, which in silver is higher now than at any time since early 2008 (before the crash). Gold open interest has been in decline since 2011.
Most traders focus on price. They think that silver at $19.40 is cheap because it’s at the low end of a trading range. They think a gold to silver ratio at 66 is high because it’s at the high end of the ratio.
It’s a little scary that the low in the silver price, and high on the ratio occurs in a market with such strong speculative interest in silver. If speculators should capitulate for any reason, watch out. We might not go so far as to say it’s a bug in search in a windshield, but it’s at least dry tinder awaiting a spark.
We could see $16 silver and a 76 gold to silver ratio.
© 2014 Monetary Metals
Interesting and stimulating as always Keith. I think some of the readers might need a review of the terms:
Basis = Future – Spot
Cobasis = Spot – Future
I also appreciate the final sentence, possible “actionable advice?”
“As speculators sell, the scarcity of gold goes up and dollar price goes up with it.”
Is that a typo? Perhaps I am completely misunderstanding you, but shouldn’t it be “As speculators buy, the scarcity of gold goes up, and the dollar price goes up with it.” ?
Good catch. It should read “as speculators sell (gold), the price of the dollar goes up and the gold cobasis with it”.
Or is the idea that speculators represent a pool of gold with the highest willingness to sell (high availability). When speculators sell, transferring gold to inelastic holders (hoarders & jewelry mfrs), that high availability pool shrinks, making the supply less responsive to increased demand and therefore more susceptible to price rise?
Keith did you come up with any more info on India paying interest on gold? I see on Zero hedge that “South Africa reels from unexpected bailout, one Bank has a modest proposal:give us your gold”…..they will pay a dividend/interest on your gold. How can this be?