
The Gold Futures Open Interest Caper
In the recent Gold Basis Report, we published a graph showing the open interest in gold and silver futures (i.e. the number of contracts held at any given time). At the time of the crash and in subsequent days, the open interest number decreased only modestly in both metals. A number of people asked me the question: why did the numbers drop so little? Wouldn’t one expect to see a big drop?
Here is a chart that zooms in to a close-up on the days around the crash, labeled as clearly as possible so the date of each data point is clear. We included only gold for clarity, but silver looks similar (in this article whatever I say about “gold” applies equally to silver).
Gold Price and Open Interest
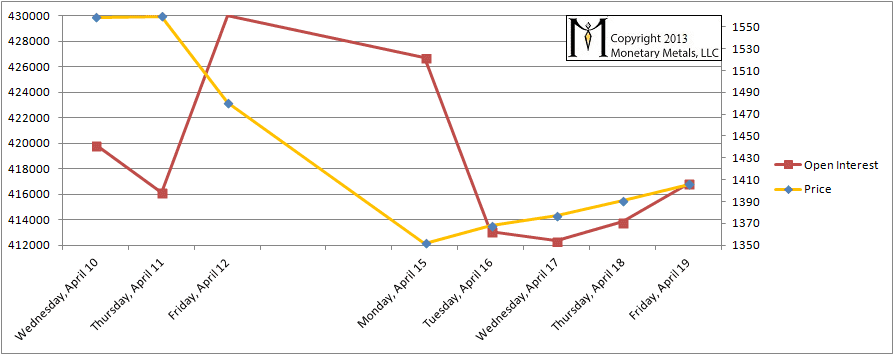
On April 11, the price was still steady around $1560. The first big crash occurred on Friday the 12th, with the price dropping $80 to around $1480. It is noteworthy that open interest rose about 13,900.
On Monday, the price dropped an additional $130 to $1350, and the open interest declined slightly by around 3,300.
There is no evidence in the open interest graph for the naked shorting of 163,000 that is alleged to have occurred on Friday, April 12.
Now let’s look at the basis (short explanation of the basis here) graph. Basis is Future(bid) – Spot(ask). What would happen to the basis if mass quantities of futures were dumped (on the bid)? As we see below, it didn’t happen.
Gold Basis
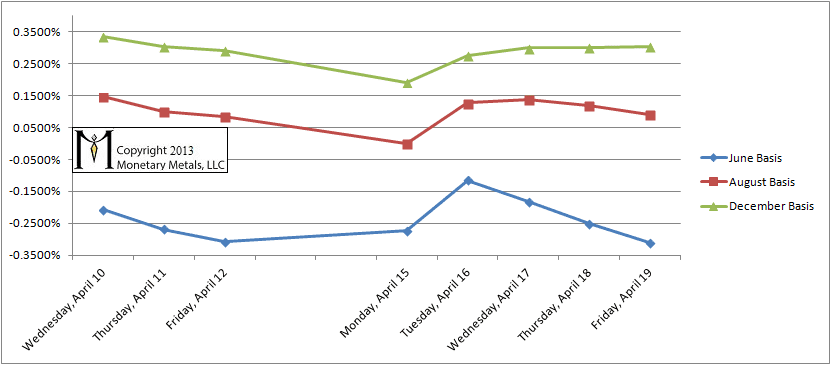
Note the scale of the graph. Each line is 1/10 of one percent. In absolute dollars, that is about $1.50. The basis is annualized, so for the June contract, approximately 1.5 months from going off the board, each line represents about 20 cents.
Before we go any further, let’s just take note of that. Supposedly, 163,000 futures are dumped with the effect of causing the price of “paper” gold to drop by $80 and then (presumably) more futures are shorted to cause the price to drop by an additional $130. The change in the spread between physical gold and “paper” gold falls by about 20 cents in the June contract, and even less in the farther months.
Just so we have this straight.
Much of this fall in the basis occurred before the price drop on Friday. From Monday to Tuesday, the basis rose in the largest move we show on this limited graph. From Monday to Tuesday, “paper” went up relative to physical about 30 cents.
Sorry Gold Bug Man, the basis cannot be faked.
I have written here, here, here, and here (and elsewhere) to debunk the conspiracy theory that “they” are selling futures short, naked, in order to suppress the price. We also address the conspiracy in the Gold Basis Report. I went on Capital Account to talk about it. I am sure I will write about it again in the future. But for now, let’s move on.
This whole caper is like the dog that did not bark in the night. We did not see the kind of change in open interest or in the basis that we would expect for a $200 drop in the price caused by naked shorting.
Conversely, this leads to another question that a number of people have asked me via email: why did we not see a sharp drop in the futures to correspond with the sharp selloff in price?
This is an area that seems simple and obvious and yet it is actually counterintuitive. Let’s drill deeper.
In Part II (free registration required), we look at the identity of the typical trader who is short gold and the mechanics of creating and destroying futures contracts within the computer that runs the COMEX market.

Leave a Reply
Want to join the discussion?Feel free to contribute!